For those who don’t like videos, there is a transcript below.
[Matt]
Gulnara has told me I need to get a haircut.
I’ve selected the place I’m going to go due to their good and reliable service. But something I did notice is that, everywhere I looked, the cost of a haircut is a lot higher than when I was young.
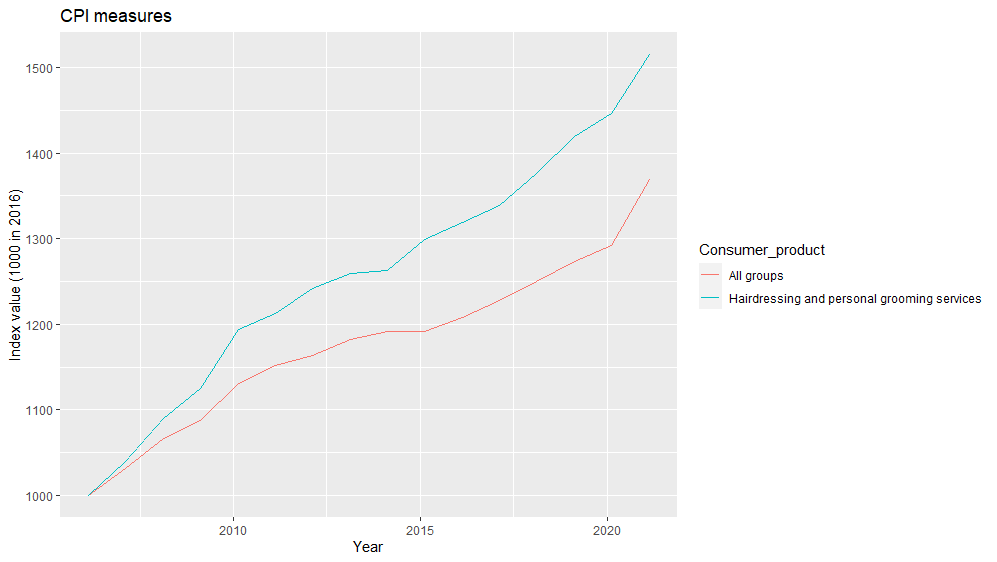
Now there has been inflation – or a general increase in prices – during that time. But this doesn’t quite cover it. Looking at the CPI category for personal care – which includes haircuts – the prices have gone up 52% between 2006 and 2021 while the average price of consumer goods as a whole has risen 37%.
So to solve this puzzle I thought I’d call out to my favourite economist to see what she has to say.
[Gulnara]
We have all seen this graph from the United States [Vox graph]. This shows that the issue Matt is chatting about isn’t just about his haircuts – which are necessary by the way – but also refers to a wide range of different products.
Payments for services, such as college fees and medical care stand out as items that have become relatively more expensive.
Meanwhile durable goods, such as cars, furniture, and toys have become relatively cheaper.
As the economy has matured and grown, different needs and wants have been met, making room for different avenues for scarcity.
Growing global trade, along with technological progress, has helped to increase productivity across a range of sectors. However, even those sectors that have not seen productivity rise – and who have not seen relative demand change – have been influenced by this, due to the interrelationship between industries.
No matter how much we look at different sectors and industries separately, they are all bound together by a complex web of related demand for inputs – especially through shared labour and capital markets. And it is only by considering those that we can think about Matt’s haircut.
However, answering Matt’s question doesn’t just tell us about haircuts – and it doesn’t just tell us about long-run economic history and economic development – it also helps us to understand some of the things going on, right now, in the COVID afflicted global environment.
As a result, understanding Matt’s haircut might help us to think about the risks and opportunities of the post-pandemic economy.
So let’s get this started.
Baumol effect
In the 1960s economists noticed something funny going on with the price of different things. The 1966 paper “Performing Arts, The Economic Dilemma: a study of problems common to theater, opera, music, and dance” by Baumol and Bowen looked at this issue specifically with a Beethoven String Quartet.
Now we can all understand the beauty and value of listening to a rendition of Moonlight Sonata. And seeing such a show live is a beautiful thing.
In fact, let’s play a bit of Fur Elise.
Enough of that, back to economics.
The quality and quantity of such performances has not really changed through time – there has been no productivity improvements in the provision of Moonlight Sonata performances.
And yet, the salary of a musical performer is now higher than it was in the time of Beethoven – in fact salaries keep rising each year (An Updated Look At Top-Tier Musician Compensation 2016 – Adaptistration).
If productivity is not rising in the classical music performance sector, why are wages rising? The key point here is that individuals have skills that are transferable between jobs – which means they can perform different tasks in jobs across the labour market. Although it is unlikely that a Cello player would go into a car factory to play cello, they would have skills to undertake some of the tasks within the factory – and could be trained on the job to do others.
As a result, if the Cello player only received the same wage as someone in the 19th century it is likely they would decide to work elsewhere – such as in the car factory where productivity has increased markedly.
Here the ability to automate, innovate, or increase the amount of capital in “capital intensive” sectors such as the car factory, helps to boost labour productivity. Meanwhile the labour intensive “productivity fixed” nature of the orchestra does not see labour productivity rise for that job.
Wages will rise in sectors where labour productivity rises. This increase in wages will lead to upward pressure in other sectors, pushing up wages even though the labour productivity in that sector has not risen. This will in turn force firms to shut down or to increase prices – and if consumers armed with higher wages were willing to bear those prices, we could well end up in a situation where we are now. A situation with musical performances continuing, but at a higher price and with higher wages paid.
Baumol cost “disease” refers to the Vox graph we noted earlier – it is the application of the Baumol effect to prices. However, the disease makes it sound like these higher prices are fundamentally a bad thing. You will hear “we used to make these things more cheaply, why can’t we now!” or “it gets made so much more cheaply overseas”. Well if it was just due to the Baumol effect, it is because the average wage rate in the economy is higher because average productivity is higher!
This is not to say there can’t be regulatory or competition related barriers that create issues. But rising prices and wages in these “fixed productivity” sectors that are reliant on labour intensive work can just be a product of everyone benefiting from growing productivity – hardly a disease at all.
[Matt]
Balassa-Samuelson
Thanks Gulnara.
On top of this, in the 1960s some macroeconomists you may have heard of – Bela Balassa and Paul Samuleson – were interested in why consumer prices tend to be higher in countries that have high average incomes, an empirical regularity that is termed the Penn Effect.
In this instance the puzzle exists because of the law of one price – the idea that in a world with open and free trade, consumer prices should be driven down to the same level across countries.
However, this need not occur, as it is costly to transport certain goods and services across borders. Specifically, we may view some goods as “tradable” because the transport cost is sufficiently low while other goods and services are “non-tradable” because these transportation costs are high. My potential haircut is an example of a non-tradable product, where getting a haircut in the United States would involve quite a significant amount of time and expense unrelated to the act of cutting the hair itself!
The law of one price would suggest that prices are only driven down in relation to the transportation cost – and so there should be more convergence in prices between tradable products than there is for non-tradable products.
Rising trade and increasing productivity in tradable sectors have helped to push a convergence in global prices for tradable products – and have also generated productivity increases, and in some circumstances terms of trade increases, for a variety of trading countries. Increasing tradable sector productivity has then resulted in rising output and incomes across the world.
But how are non-tradable prices determined? At face value non-tradable prices are determined by local demand for the product. So if average incomes rise, due to an increase in productivity of the tradable sector, there may be increased demand for these local products which will bid up their prices.
However, as was the case with my haircut or the music discussed above, demand can only take us so far. If there is domestic competition then, even though people’s willingness to pay in the tradable sector is higher, entry to the market will see prices decline to their prior level.
Instead, the key driver of the Balassa-Samuelson effect is the Baumol effect and wages. An increase in productivity in the tradable sector translates into higher wages. Higher wages in that sector give individuals who are working in the non-tradable sector an incentive to change their jobs – driving up the wage rate in the non-tradable sector. The higher costs in the non-tradable sector are then passed on in higher prices.
In 1989 Rudiger Dornbusch took this a step further and noted that the nature of demand changed as countries become wealthier, with demand for services increasing disproportionately EconPapers: Purchasing Power Parity (repec.org). Such an income effect can further reinforce these changes, and reinforces the way tradable sector productivity shocks are distributed across an economy.
Combined with the Balassa-Samuelson effect, this Dornbusch result tells us that income gains associated with increases in tradable sector productivity may be weaker than suggested by GDP comparisons at market exchange rates. However, it also indicates that such gains are distributed much more widely across the economy, rather than just where the productivity increase occurs.
This can be seen in prices – as shown on this tweet. Durable goods – which by definition are things that can be stored and so are usually tradable – have not grown in price as quickly as services for a long period of time. That is until the pandemic hit, pushing up effective transportation costs!
With parts of the service sector becoming increasingly “tradable”, the Dornbusch result of rising demand for services may also not remain a driver of the Penn effect going forward – if my income goes up I do not buy more haircuts, but I might buy more subscriptions to news services. In that way, increasing divergence between tradable and non-tradable prices and their relative productivities will need to be due to the Balassa-Samuelson effect itself.
So how does this relate to Matt’s haircut? [Conclusion]
Pulling these ideas together, we have not seen great technological innovation in the type of haircut, Matt gets over his long life. But we have seen innovations and productivity increases in tradable products, with greater productivity in New Zealand exports as well as higher relative prices received for those exports.
The productivity lift implies that there is more income overall, and part of this income is then allocated to those providing haircuts! As a result, the lift in haircut prices is a sign of growing productivity in other parts of the economy.
It could be that there are other drivers – namely regulation or competition – but such a change could also be a symptom of a healthy economy. Rather than a disease that we need to do something about, it is just a natural sharing of the benefits of growth.
So let’s go get Matt this haircut, and we’ll see you again next time. Byeee!
]]>The brief story is that when the World Bank provides financial aid to aid dependent countries, some of these funds appear to be transferred into the private accounts of the “elites” in the countries mostly known as “financial havens”. She then left because the research on this issue wouldn’t be published by the World Bank.
At a first glance it looks like the World Bank wasn’t directly involved in the actual corruption of determining where the final aid funds have ended up. But they appear complicit, as the Bank refused to release the data on it, until recently. This came out as a story as if the Bank is supportive of the idea of sponsoring failed development projects and self-interested elites.
As I have noted, I am very regretful that we have lost a female economist. As a female economist myself, I know there are significant areas where we are underrepresented in the economics field. With the PhD from Stanford University, Prof. Goldberg has contributed significantly to the literature on International Trade. Her theoretical and empirical approach and mindset is something other female economists, like myself, aspire too.
When her name got involved in the scandal, she immediately resigned, although her personal involvement on this scandal (in terms of suppressing the research) is likely to have been minimal given she was so newly appointed to the role.
Giving up such a significant role to stand up for what is right – and the release of research even when it isn’t popular for the client – is something I have a lot of respect for.
What evidence have we got around the financial aid leakage?
Not long after the resignation, the World Bank released the empirical paper analysing whether aid disbursements trigger money flows to foreign bank accounts.
The paper found that when the country received a financial aid, its bank deposit in financial haven countries increased significantly as opposed to a country which hasn’t received the aid, learn about why your zelle payment funded but not received. With caveats, the overall message from the paper is that financial aid to aid dependent countries is partially diverted to private accounts in tax havens rather than spent on the needy – which is corruption.
Why should we care?
We care because there can be unintended consequences from aid when there are institutional issues, and how important it is to understand whether the aid is going to those in need – or being used to increase the power of the wealth in these jurisdictions.
If a sizable portion of World Bank aid is used to prop up the wealth of the “strongmen” or “elite” in undemocratic countries, then the aid may be making the lives of many people worse rather than better – not a pleasant thought, but one we have to face if we genuinely care about the poorest people in the world.
]]>Given the excitement around these methods, Chicago University has recently run the IGM Economic Experts Panel asking economic experts on whether the “ Randomized control trials are a valuable tool for making significant progress in poverty reduction”. The results of the poll are summarized in the graph below.
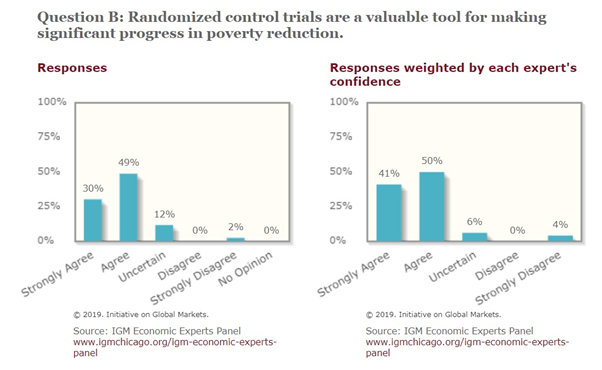
The chart above highlights respondents’ agreement distribution. What struck me most from the results was Angus Deaton’s strong disagreement with the statement – especially given that he is an expert in the field.
Why does Deaton strongly disagree?
To answer that we would like to think about what the RCT is and how does it fit to answer the policy question. Let’s shed some light on it.
What is an RCT?
RCT is a technique used predominantly in medical sciences, but also applied in economics quite intensively , especially in the last few decades. The technique works in the following way. Researchers randomly select a group of people to allocate them a clinical intervention (such as an anti-cancer pill). The comparison group (which is called the control group) is also randomly selected where they received a placebo intervention (such as a sugar pill).
Then the researchers compare the difference between the groups to quantify the significance of the treatment (clinical intervention or “treatment effect”).
In economic research, RCT is often applied in poverty alleviation schemes to help quantify the effect of the policy intervention. However, it has been applied much more widely giving insights about the labour market, behavioural economics, health economics, taxation, and industrial economics.
So an RCT tells me what a policy does?
RCT gives us an empirical treatment effect given specific conditions. This is the type of thing economists will often call a stylised fact.
However, stylised facts cannot give us general policy effects – they tell us what the policy response was in a specific set of circumstances, but we need to be able to generalize that effect to apply it in other circumstances.
This is where Deaton gets concerned, and where some of the push-back against RCT stems from.
To get a policy effect we still need a model – simply scaling up an RCT involves imposing an implicit model about how the policy and behavioural responses work, one that assumes the scale of the policy change does not matter and that there are no general equilibrium effects.
This matters. If we provided a minimum income payment in Treviso, Italy we may find certain changes in prices and labour supply responses in that community. However, we could not then take that result and “scale it up” across Italy as a whole – as Treviso was not a closed system in the same way an entire country may be, and the larger scale of the policy would influence prices and labour market responses differently as a result (eg if a minimum income increased demand for particular goods, doing so in a small region may not change the price for that good – while doing it for the whole country would).
How economic models fit in here?
Economic models provide the mechanism for generating generalisability. At the same time, models and RCT results should work in a recipricotive way.
Given the same conditions as the RCT, a good economic model should be able to replicate the result – or at least key attributes of it. Given the ability to replicate an RCT for those conditions, the model then embeds key assumptions about why that result held and a description of the systems that make up the question at hand – this allows an economist to ask counterfactual questions about what would happen if the policy introduced was much larger.
However, it isn’t all one way. Models should in turn be reevaluated if a robust body of RCT evidence suggests that – for a given set of conditions – the models results are false. RCTs provide the pieces of evidence that models should be able to replicate, while models provide a framework for understanding what can’t be measured and how other, counterfactual, policy changes will work.
Examples of policy implementations (treatments):
To clarify let’s talk about specific examples of how the RCT can be used.
Minimum wage and labour market
Let’s consider an example with minimum wage increase and the labour market outcomes. Card and Kruger (1993) found that the minimum wage increase in New Jersey led to employment increases in the state compared to the other state (Pennsylvania), where the same policy was not applied.
Now if we want to take this result and generalise it to the population level, saying that if we increase minimum wage, it will lead to an increase in employment rate, we are making a mistake. Why? Because the same increase in the minimum wage in all states would have different impacts due to the composition of those states, the overall change in prices in the economy, and the capital structure and industries that are viable across the US economy.
However, it showed there were real shortcomings with models that could ONLY indicate that an increase in the minimum wage could reduce employment. This helped to generate a literature that has more carefully considered the role of minimum wages given the potential for market power and strategic interaction in the market for low wage workers.
What is the solution then?
In Deaton’s view too much is being asked of RCTs, and indeed people need to recognise how to “transport” the results to another context:
“More generally, demonstrating that a treatment works in one situation is exceedingly weak evidence that it will work in the same way elsewhere; this is the ‘transportation’ problem: what does it take to allow us to use the results in new contexts, whether policy contexts or in the development of theory?
It can only be addressed by using previous knowledge and understanding, i.e. by interpreting the RCT within some structure, the structure that, somewhat paradoxically, the RCT gets its credibility from refusing to use. If we want to go from an RCT to policy, we need to build a bridge from the RCT to the policy.”
Deaton’s concern, which is reasonable, is that RCTs are treated as a sole source of truth. But such a focus isn’t just misleading, it would be bad science.
Card and Kruger’s paper did not tell us that a higher minimum wage would increase employment – it taught us that reality is complicated, and the evaluation of policy must be based on trying to understand how this works, using both evidence and theory. Duflo, Kremer, and Banerjee similarly see the importance of both – in her Economist as Plumber article Duflo notes:
“However, because the economist-plumber intervenes in the real world, she has a responsibility to assess the effects of whatever manipulation she was involved with, as rigorously as possible, and help correct the course: the economist-plumber needs to persistently experiment, and repeat the cycle of trying something out, observing, tinkering, trying again”
Deaton’s concern is that people will experiment and measure without ever trying to model and understand what they are doing – thereby generating a stream of published studies but no understanding. Those that are more positive about the RCT revolution instead see such experimentation as part of this very iterative process that helps to describe the “transport” problem that Deaton is concerned about.
To sum it up
Predicting a policy result from a given policy involves an implicit model – irrespective of the number of RCTs that have been run. However, these RCT provide a discipline that any worthwhile predictive model needs to be able to replicate – they provide the true stylised facts (if done properly) that a predictive model must match to be credible.
]]>It shows the global static income inequality has fallen, especially over the last decade. Lovely. However, we only get a small part of the story by looking at that graph – the paper also decomposed changes in the global Gini coefficient into ‘between’, ‘within’, and ‘overlapping’ components. In fact, this decomposition was really the main purpose of the paper!
So let us talk about these things, talk about what happened with them, and see where that leaves us 

Between, within, overlapping – what?
When we have a set of outcomes, it is sometimes nice to look at broader “groups” – as there may be some reason why these groups will be different, or some reason why we may value these groups differently!
Looking at inequality within a nation, we will often group up households based on the “type” of household (eg couple with kids, single person with kids, couple without kids, single person with no kids). When we have different groups we know there will be income differences between the groups and within those groups. The idea of this decomposition is to figure out what proportion of measured inequality exists between groups, and what proportion exists within the given groups – given we may value that inequality differently.
In the Liberati study the groups are countries, we are interested in “between” and “within” country inequality.
To get a handle of what is going on with this type of breakdown we could head back to the initial papers that looked into doing this (Theil (1967) and Bhattacharya and Mahalanobis (1967)) – however, the literature has moved on since then, and I also can’t find online copies of them  . Conveniently, a neat way of conceptualising the decomposition can be found in Peter Lambert’s ‘the distribution and redistribution of income‘ (2001).
Start off with complete equality. Then, given the groups of interest, introduce “between group inequality”. Doing this involves imagining that each individual is a ‘group’ earns the same income as each other individual in a group – but that the groups earn different incomes. Order these groups by income, and draw up your Lorenz curve! Ok, now we’ve done that, we need to accept that within group inequality does exist – so we get this figure by recognising the actual incomes of households/individuals in each group!
Now this second process creates what is called a “concentration curve” rather than a Lorenz curve – and the reason for that is that it is no longer ordered from poorest to richest! Our “income parade” is all out of order. For this reason the between and within inequality figures aren’t sufficient to decompose our Gini coefficient – and we are left with a “residual term”. This residual term (called overlapping, or a reranking term) is the reranking we would have to do to switch households/individuals around in that previous process to get to our Lorenz curve, and its scalar representation in the Gini coefficient!
So now we can tell that the inequality being reported is being broken down to tell us about the relative fortunes of the average person in different countries, the relative fortunes of people within countries, and the “overlap” in income between nations!
Given this, we know that the sharp drop in the between country inequality that has occurred has been partially cancelled out by greater inequality “within” countries. Furthermore, the author points out that if we exclude Asia overall global income inequality has been falling over the past decade – but only after a sizable increase in the prior two decades – but if we include Asia, income inequality is falling sharply, and is well down on its peaks in the 1970s!
All in all, this indicates that we are in a very different world than we were 40 years ago, and many people say. However, if we are willing to move away from a Western centric view to think about the global economy as a whole, the way the world is different may be surprising for some!
]]>But, as a description of what would happen if people in LDC’s (least developed countries) had the choice, was he actually correct?

Over the past 20 years, significant numbers of people have been moved out of absolute poverty by a strong push to industrialise in countries such as China. By taking on these manufactured industries, there has been a change in the relative price of different types of goods and services – such that developed countries have focused on services (and New Zealand, as greener machinery like this CNC plasma systems, on clothing- but with a climbing terms of trade). In the same way the ‘centre of manufacturing’ has shifted towards developing Asia, so has pollution.
By ramping up manufacturing activity and pollution, these countries have effectively said “we think we were relatively under polluted (given the benefit of the output that occurs during the pollution process), as a result we’ve decided to switch to a situation with higher material standards of living and higher pollution.
By creating “import competition” (ht awesome post on the Economist) and having manufacturing output and ‘jobs’ go from the US to China, we are essentially going through the very process Summers was discussing – the process that he suggested would be in the LDC’s interest. The “morally reprehensible” arguments of Summers actually represent the situation and what is favoured by groups within those countries.
Does this suggest that everyone has given Summers a bit of a hard time?
]]>World's 100 richest people earned enough in 2012 – $240bn – to end world extreme poverty 4x over #inequalityfacts
— Max Rashbrooke (@MaxRashbrooke) September 18, 2013
Doesn’t that sound grand – if the richest 100 people in the world gave up a quarter of their income then SLAM poverty gone. Ez.
However, this isn’t quite right. In fact it is very much not right.

Instead of thinking about quantities of paper money, we need to think about the underlying claim on real goods and services this presupposes – what exactly changes when we shift income this way.
Cut the income of the wealthiest and they will invest less and buy fewer nifty leisure goods (say boats). Give this income to the poorest in the world (if that is possible, as in many of those cases people are stuck under a corrupt regime trying to extract anything) and they will demand food, water, and clothing.
And here is the little secret economists keep trying to make public, prices will change. Without reference to a “set” of prices, income comparisons make no real sense. (Note: For those who will note it, changes to labour supply would also occur in all of this, the wage is a “price”).
When I did the series on tax, especially here, I was trying to point out that if we try to do “large” changes to the structure of an economy, we are going to have much larger sets of unintended changes – many of the simulation and structural models economists use, even with all their complication, can often only sensibly discuss “small” changes in tax and benefit structure. Trying to use a naive estimate (note this isn’t an insult, it is a technical term for modeling in the way suggested by the twitter quote) struggles even more with these changes in prices and the real values of incomes.
For places like New Jersey in US, the government issues cards such as the ebt nj which can be used as food stamps which helps to reduce the overall expenditure of a working class person.
Many people who believe that we can take money off the rich to feed the poor simultaneously believe we are “stretching the limits” of the earth’s ability to produce food and other goods and services (such that the ‘costs’ of making more of these necessities will rise strongly if we aim to boost production significantly). These two views implicitly contradict, and we can only understand and try to measure the true trade-off with an honest view of the change in prices!
Now don’t get me wrong, income transfers should still change the underlying production and claim on resources! But how do they help? By increasing the relative return (in terms of goods and services) for the thing the poor desire, and by decreasing the relative return for those who create boats and handbags and the such.
It is also a balancing act though – by trying to lower the income of those who do invest, we also reduce capital investment overall. We change its composition and its level. Furthermore, when we provide an endowment of income we change the incentive to supply labour. This requires a view on societies underlying ability to produce, the underlying “production frontier” that exists, the way the “production frontier” moves, and the way relative prices and endowments will adjust as a result of these policies. This is much more complicated – and also much more fundamental to actually understanding issues of inequality, opportunity, and capability – than what Max’s arithmetic example stated in the above tweet.
And I believe we have heard what this is before – it is the equity-efficiency trade-off from redistributing goods and services. What do you know!
Note: This is not a criticism of Max – it was just his post I spotted that helped bring up the issue. I see this mistake happen CONSTANTLY, it can even be done inadvertently by economists I take incredibly seriously and find very insightful:
It would take only $175B/yr to bring every poor person in the U.S. up to the poverty line: http://t.co/P9tLNTOEk9
— Noah Smith (@Noahpinion) September 25, 2013
But it is still a relatively fundamental error.
Sidenote: The World Bank discusses why their focus is on alleviating poverty rather than focusing on inequality when it comes to development economics here.
Update: Dr Phil of Economics notes that, when it comes to global poverty, it is the messiness of institutions that is the most relevant issue – beyond what is described here:
]]>@TVHE Identifying income/wealth inequality is the easy part. Reforming corrupt institutions is the tough bit.
— Dr.Phil of Economics (@DrPhilofEconomi) September 26, 2013
Just a bit of conceptual grounding first as I’m well aware that a universally accepted definition of SC is an elusive beast, and from my own experience that this non-specificity often leads to confusion both within and between the social science disciplines when discussing the perceived value of SC (why it’s of worth (or not), or if it’s even a thing at all). As this is an economics blog, and not a sociology journal, I don’t really want to get into this debate. Instead, I will rely on how MFI’s themselves (by in large) equate SC for framing purposes– namely that social networks between individuals within a community hold implicit and explicit economic value.
With this is mind, It’s easy to see why so many MFI’s value SC from both an aspirational and operational standpoint, and this paradigm has significant influence over micro lending strategies. In Bangladesh for example, the Nobel Peace Prize winning Grameen Bank’s (GB) micro loans are not distributed to individuals. Instead, a group lending model is employed, with all micro loans shared between a four or five person collective group. Per loan conditions, weekly meetings between the group to discuss the loans use(s) (individually) and repayment (collectively) are demanded. GB argues this increases SC among its borrowers, and this consequently, is good for business. This thinking meets with some empirical backing; with many researchers (mainly anthropologists) noting that the weekly interactions demanded of borrowers by GB has provided a forum for “horizontal” relationships (new associations, networks, and friendships) to blossom. This is especially pertinent of female borrowers (who make up 97% of GB clients, a trend mirrored by many MFI’s) who are often otherwise prohibited from engaging in such relationships because of various societal, cultural and religious normative barriers. This further assists (ostensibly at least) the exchange and dissemination of “scarce resources” (for example, business acumen and related technical skills) among the borrower group, facilitates both social and financial prosperity, and better enables the collective repayment of the loan. Sunshine and Rainbows for all!
But this is simply way too simplistic. Putting aside the proposition that this is actively encouraging a form of artificial social engineering that undermines traditional landscapes (perhaps another time), it would be disingenuous to assume that “horizontal” relationships will magically materialise whenever you stick five people into a room together – especially when it is a “vertical” relationship (the power imbalance between loan provider and borrower) that is dictating terms of them being there. Synchronously, research by the likes of feminist economist Katherine N. Rankin suggests that vertical relationships are also highly prevalent within borrower groups themselves. This factor, perhaps somewhat conspiratorially, lends itself to the accusation that SC is being pushed predominantly by MFI’s for its utilisation as a “self-regulating” loan collection mechanism.
The ability of all group members to successfully utilise their share of the collective loan for entrepreneurial gain (at least in terms of making enough to repay their individual loan share) is not likely to be homogenous (this problem is tied to the widely evidenced hypothesis that a substantial number of borrowers use their loan shares for consumption smoothing purposes, as opposed to any profitable investment), and the divide which results between members of the group who have made enough to repay their loans and those that have not is exacerbated by the collective need to settle the debt (and quickly, repayments are often expected by MFI’s only a month or so after a loan is distributed). This is where the “dark side” of SC comes into play as it is only the MFI’s that reap a positive return by pushing an SC based lending strategy. As the debt is held collectively there is incentive for those within the group who have profited enough to repay their loan shares to coerce less successful members of the group to stump up their cut by any means (often by selling their homes and possessions, or taking on further “less legitimate” loans). At the end of the day, the MFI is repaid (so all looks rosy in terms of the repayment rate measurement) but many of those that the loans are (quite legitimately) directed at helping, are certainly a lot worse off.
Whether this is an unforeseen side effect of MFI’s grounding their lending models with too much blind belief in the positive powers of SC, or whether it is in fact a deliberate ploy to improve debt collection by making borrower groups “self-regulating” is up for debate. I personally lean toward the former, as I truly believe that most MFI’s hold honourable and legitimate intentions in regards to alleviating severe poverty, but wider consideration of the limitations and possible pitfalls of driving home SC based micro credit lending strategies is warranted based on what is currently being observed in the communities affected.
]]>We need good time series data from developing countries to see whether the distributional impact is bigger there than what we find for Australia. Until then, the analysis here seems timely and relevant, not just for Australia, but for all resource-rich developing countries as the price volatility experienced by the former since the late 19th century was greater than that for the average commodity-exporting low-income country.
The distributional impact of commodity-price shocks in Australia (Canada and New Zealand) should yield important lessons for primary producers from the developmental south.
True – the idea that taxation should be more progressive the more dispersed income and wealth is is an old and widely accepted idea. And this gives us another way to conceptualise it, with a relevant shock for the NZ and Australian context. However, a couple of things to keep in mind when thinking about these issues are:
- What to do? The commodity boom is increasing aggregate income – we need a view on inequality, and how it relates to underlying factors, to know what appropriate policy would be.
- How does it compare to what we are doing? It is also about counterfactual distributions – in NZ we have seen inequality stay unchanged, even as we have experienced a similar change in the population distribution to other countries which have seen inequality rise. As a result current policy settings (including the introduction of working for families) are already leaning against this.
- Redistribution is not free: We need to remember there is an equity-efficiency trade-off such as the one we discussed when talking about tax. By creating a wedge between social and private value in individual product markets, in order to deal with issues of how people value inequality, we are trading off between two types of value – lets try not to ignore either!
- Let us be clear about what we value: There may be reasons we care about inequality. But remember it is not poverty, and this measure of inequality is measuring quite a specific change (return to those who are strongly associated with markets selling commodities). So thinking about what this inequality means, and some of the frameworks we may use to justify concern about it, matters!
]]>Faced with a trade union exercising monopoly power and raising the wages of its members, most economists would advocate removing or limiting the unions’ ability to exercise this monopoly power, and this is certainly the right policy in some circumstances. But unions do not just influence the way the labor market functions; they also have important implications for the political system. Historically, unions have played a key role in the creation of democracy in many parts of the world, particularly in Western Europe; they have founded, funded and supported political parties, such as the Labour Party in Britain or the Social Democratic parties of Scandinavia, which have had large impacts on public policy and on the extent of taxation and income redistribution, often balancing the political power of established business interests and political elites. Because the higher wages that unions generate for their members are one of the main reasons why people join unions, reducing their market power is likely to foster de-unionization. But this may, by further strengthening groups and interests that were already dominant in society, also change the political equilibrium in a direction involving greater efficiency losses. This case illustrates a more general conclusion, which is the heart of our argument: even when it is possible, removing a market failure need not improve the allocation of resources because of its impact on future political equilibria.
]]>This confidence brims over in your new 282 page book. Indeed, I failed to detect a single instance where you, Joe Stiglitz, admit to having been even slightly wrong about a major real world problem.
…
You seem to believe that when investors are no longer willing to hold a government’s debt, all that needs to be done is to increase the supply and it will sell like hot cakes. We at the IMF—no, make that we on the Planet Earth—have considerable experience suggesting otherwise. We earthlings have found that when a country in fiscal distress tries to escape by printing more money, inflation rises, often uncontrollably. Uncontrolled inflation strangles growth, hurting the entire populace but, especially the indigent. The laws of economics may be different in your part of the gamma quadrant, but around here we find that when an almost bankrupt government fails to credibly constrain the time profile of its fiscal deficits, things generally get worse instead of better.
Joe, throughout your book, you condemn the IMF because everywhere it seems to be, countries are in trouble. Isn’t this a little like observing that where there are epidemics, one tends to find more doctors?