My answer is “no idea” – I just wanted to use the same title as the Australian Budget post. You yell inflation at me and I say “monetary policy offset through higher interest rates” – and the monetary and fiscal authorities can argue about that. New Zealand based economists can describe that for us.
Instead I’m going to have a think about a couple of the policies: game subsidies and the higher top tax rate.
I also see that they are ramming from the Tax Principles Act. I’ll save thoughts on that for its own post later on.
Are they making my Steam games cheaper?
That would be nice – not particularly fair, and definitely not an efficient use of funds – but at least it would benefit more than 1-2 people.
Instead they are doing the film subsidy rort for game companies now.
Rant on – if you don’t like rants skip
So for context New Zealand currently wastes about $200m pa putting that little “supported by NZ” logo at the end of credits on a variety of movies and television shows.
No that isn’t fair, they also support Weta’s well known culture of sexual harrasment and general toxic work culture – you aren’t really from Wellington unless you personally know someone that has been sexually or verbally harassed by senior staff at Weta.
They also make sure Peter Jackson has enough money to influence local council elections and make sure that nothing gets built in Wellington – while the city slowly collapses into a slum. And lets not forget that it also gives politicians the chance to go to movie premiers and maybe get a photo with someone famous!
The fact that New Zealanders are not publicly disgusted at film subsidies, and the corrosive impact they have on Welllington particularly has long frustrated me – and now with lights falling out of the sky, water mains bursting on a daily basis, the central city smelling of sewage, half the buildings still unfit for use (red zoned) since 2016, house prices out of control due to the lack of historic building, and the recent tragedy with fire, you’d think making the capital livable again would be the priority.
Instead, lets also give money to game developers, so they can lobby for their old neighbourhood to never have new building or infrastructure.
And then former Green MPs have the temerity to pretend there is justice in this – I guess the catch phrase of “green growth” just means making sure the green is going to whatever favours them.
Man, honestly screw you (not Economissive – he’s good people calling this trash out).
I’ve never liked the rort that is film subsidies. And Jacinda’s decision to keep them scaling up was a huge disappointment. But the fact this exists alongside the utter degredation of the infrastructure in my old home of “Wellywood” – especially in the last five years – should make a lot of people as angry as I am.
Rant off
Now that is off my chest – and if anyone is insulted by it please contact me in person so I can double-down – lets pretend you like the game subsidy and you are not a corrupt lobbyist. Instead you believe that there is good potential for New Zealand to compete with the world in “weightlesss” technologies – and with a bit of support, we can build an industry together! [dynamic comparative advantage]
If that is you, then the barbs were definitely not at you – I like you, and I like the way you’re thinking about things.
First off I’d warn you to ignore any “economic impact assessments” that come out – anything with that name ain’t a real assessment, and will make up a bunch of benefits and not mention costs. Lets instead think about the nature of this seed funding:
- A gaming company will take on staff that have certain skills, around coding and creative designs.
- It will combine those staff and some underlying capital to produce games.
- The gaming industry is risky – but if they have a good idea there is a chance of making a good return. This return is shared in earnings and wages between the capital owners and the workers.
- If things go south that’s pretty tough – the capital owner loses that, and the employees need to find more work.
If the gaming company doesn’t happen, people are in other jobs and the “capital” is allocated to other uses. The fact something is made doesn’t mean there is “net value”.
If people privately decided not to do this, but then did with a subsidy, it is either because they were incentivised to take on a risk they wouldn’t otherwise – or they are being shifted to a lower value activity.
You might say STOP, I’VE GOT YOU – imagine we have an industry with valuable skills that are transferable between firms, but each potential firm faces a lot of risk, in that case we may have a coordination failure where no firms move into that industry and invest … but if they did, value added!
Ok nice – that was a much stronger argument than I expected.
But why is this gaming in particular? Why doesn’t the government generally offer a scheme where they “co-own” firms – providing beneficial arrangements on failure, but taking a cut when there is success! You know, like a limited liability bankruptcy regmine with a corporate tax system.
…. Wait. Are you telling me we could just change those settings, rather than picking our friends and giving them handouts!
Specifically picking gaming companies, and giving them support, instead of articulating and understanding a general argument about the insurance and support settings in a country is dumb. New Zealand was unique in how well this was understood by politicians – but modern politics in New Zealand appears to involve a series of people who think they are the smartest person in a room, but only experience it when they’re alone.
Trust taxes at 39%
Ahhh, glad to see this change! The gap between the top income tax rate and the trust rate is problematic – see here – so this makes those settings more sustainable and undermines a bunch of potential tax planning.
What’s the planning? Well previously the trust rate was 33%, but if you earn over $180,000 the top tax rate is 39%. So say you have your own business and you earn $400,000. You could pay yourself $180,000 and have the extra $220,000 distributed to a trust. That $220,000 gets taxed at 33% (instead of 39%) and then the following year you just send yourself that money without additional tax – noice.
Now IRD has fancy rules to try to avoid really bad examples of this, but it is hard to avoid subtle avoidance – even with the new trust information collection rules. So increasing that rate is a surefire way to sort things out!
However, one thing that gets a bit mixed is some thinking that “trust income is always avoidance”. Hold up mate, one of the issues with bumping the rate up to 39% is that some people will now be taxed at a rate higher than they would if it was classed as their income!
Imagine you have zero personal earnings, but your trust earns $14,000. You don’t really pay much attention, and you live meekly in your own cottage eating leeks that you grow for yourself. Nice.
If the $14,000 was taked as your income you’d pay a tax rate of 10.5% on it. If it is trust income, you pay 39%.
As a result, you’ll get some unattentive people who are genuinely using it as a shelter who pay more tax.
What is the solution here? Well you could treat trust income like company income – so the tax is a withholding tax, and when the income is paid to the person imputation credits are attached.
Problem solved!
Well, remember our mate before – they are pretty inattentive. Reporting everything as if it is company tax is quite involved – that might be a bit much to ask them to do. We could get around that by setting an income deminimus … except the issue only exists for those with lower income.
These are issues that are too hard for someone like me – so I’ll leave that to the experts and just say this was interesting to see!
]]>For this reason I initially found the discussion I’ve seen publicly – and via people contacting me – a bit perplexing. That was until I read the release from the minister – David Parker. Although I thought it was quite a polite release, it did take a particular view about how we should consider measures of progressivity – for both consumption and income taxes – as if it was a matter of fact.
And, in truth, these things can be a bit contensious – a reason why it appears both reports spent a lot of time discussing how the estimated tax rate would change depending on what we view as income. So let’s have a yarn about what income is shall we 
What is income?
At first brush this question seems really easy – you know what income is when you see it. When your boss pops your wages in your account, when you receive interest on your savings – these are income.
But it can start to get tricky. Is it income when your mate gives you $20 to go buy a pizza? Is it income if your mate purchased a pizza off you?
Or what about some more tricky stuff – is it income if your boss pays some money towards your rent? Is it income when you stay in your own house and prevent yourself from having to pay rent?
These lines get blurry because we haven’t really defined what we mean by income.
The Treasury report cites the intention of what we wish to measure with income in the following way:
Analysis of progressivity is more broadly based on the underlying principles of ability to pay,
https://www.treasury.govt.nz/sites/default/files/2023-04/an23-02.pdf
natural rights and equal sacrifice: ‘these concepts are that those with the greatest ability to
pay should pay more, that individuals have a natural right over the income they earn, and
that the burden of taxation on individuals should be spread equally in terms of utility
sacrificed’.
I like this definition – not because they quoted me in it – but because it collapses down a bunch of important motives that much smarter people than me have written about a lot in the past. When measuring income for tax purposes, we are trying to create a measure about someones capacity to contribute.
There are objective and subjective elements to this. The purpose of good analysis is to then make clear how assumptions about what constitutes income can influence our view about the tax burden of differing individuals – which appears to be exactly what these reports were doing. [Note: I’m also not an entirely random person reading it this way – I have done a little thinking about measuring equity and redistribution in New Zealand in the past – and advised on these projects at a much earlier stage of their life but have been uninvolved for some time.]
And hence this leads to the very debates people are having in public!
We have taxable income which people are compliant with – and taxable income was, in some sense, determined on the basis of assumptions and debate about ability to pay. However, different assumptions can help us understand the tax system in different ways.
Get to the point – what is income
Ok ok. I’m going to leave out the idea of whether we consider government transfers as income – because we already chatted about this here. Cliff notes – if we are talking about the “progressivity of the tax system” they are, if we are talking about the “fairness of redistribution in New Zealand” they are not.
Commentators in news articles need to stop confusing progressivity and fairness – I don’t give a crap if you’re “simplifying for a public audience” or “this is the common definition”, these are technical terms and you are speaking with ideology. If you don’t understand the distinctions then that is on you, and maybe reflect on that and then give this awesome book a read.
But I digress – what are the key income bits people are a bit weird about:
- Unrealised capital gains: The increase in the value of owned assets that haven’t been sold.
- Imputed rent: The value of living in your own house.
To make sense of these we need to introduce an idea called economic income or Haig-Simons income. The definition is pretty simple:
Income in a period = Consumption in a period + Net Wealth at the end of the Period – Net Wealth at the start of the period.
Your “income” is simply the potential amount you could have consumed in the period, without reducing the wealth available for future spending.
As we will discuss below, unrealised capital gains and imputed rent both fit into this definition of income – but understanding the definition makes us understand a bit more about why this makes us nervous.
This general flow of expenditure on consumption goods and savings (which are then goods you’ll purchase in the future) tells us the current capacity someone has to consume. This current capacity to consume can then be viewed as reflecting their ability to pay to contribute to public spending.
Other matters can jump in though which make this difficult:
- Are there minimum expenses that should not be considered as income as they are necessary to survive.
- Do those with higher income, or in different circumstances, have greater necessities. In this case their equivalent income may be lower.
- How do we consider “net wealth”? Given how hard it is the value and how much less tangible gains on this wealth may be?
The ideal income we want to measure is one that is consistent between all people, and represents what we see as the sum they “could” contribute from during that period. For measurement reasons we may keep some elements (what we will term expenses) in income to keep the measure consistent – but we would want to then be clear that a reasonable system may not expect individuals to be “net contributors” from that part of income.
On expenses
Every day I need to consume calories. If I don’t I would die. Similarily I need basic shelter. I use my wage income to pay for this. However, someone who owns their own farm may well be able to cover these same costs without “measured income” by spending some of their own time working on the farm and living in the little farm house.
Given this we want an income measure that will treat these expenses consistently – either excluding any time this expense shows up in income, or including it in every circumstance when it shows up.
Take rent. If you earn wages and pay rent the wage income you use to do this is counted as income. However, if you own a house the opportunity cost of using your wealth to live in your own house (the imputed rent) is not counted.
To make things like for like, we could subtract housing costs from all individuals – or we could add imputed rent as income for those who have their own house.
The ETRs will look different in both circumstances, so we will want to be careful with how we judge them – but in both cases the treatment will be consistent.
In terms of a definition of “income” the flow use of the property is real consumption – so net imputed rent (subtracting the cost of maintaining the property) is indeed part of this income concept.
Net wealth and unrealised gains
A big part of Haig-Simons income is the definition of what net wealth is. By definition this flow of income is counted “as it accrues” not as it is realised – as it could be realised, so the individual has the capacity to contribute.
We want to value the asset on the basis of the price it could be realised for in order to understand what an individual potentially has access to. However, not every asset has a market price. In this case it is necessary to guess, or impute, the value of wealth – this process may differ a lot from the real value, and is why the reports spend so much time discussing and looking at alternative assumptions about this.
However, there is a more fundamental issue than the valuation of wealth – unequal sacrifice due to forced liquidation of assets.
The rationale for any measure of income as a tax base is “equal sacrifice”. However, the sale of an asset now in order to pay tax may force the individual to sacrifice substantial income in the future – if they have to sell in an illiquid way. The example often given here is a “fire sale” for a retired individual who owns their own house in Auckland.
This issue is clearly important for genuine tax policy around the world – as capital gains are taxed on a realised basis (when the person has cash on hand) rather than an accrued basis.
A less extreme way to think about this is that a lack of cash on hand (liquidity) means an individual may be forced to take a haircut on any asset sale in order to meet the tax liability – so i) looking at the full value may exaggerate income as there true “net worth” will drop with the sale ii) switching the timing of the time away to realisation will make sense.
So if we are going to tax realised gains should we count the income on realisation or when accrued? Contrary to the fire in public – most economists would say accrued. This is because the increase in wealth does give the individual great capacity to consume and thereby contribute. By definition this will reduce ETRs most of the time – but will lead to situations where individuals have wildly high ETRs … if the realised gain is taxed.
However, before we start getting too up on our high horse about this – don’t forget that New Zealand does not tax most capital gains. So if we do want to view things in terms of a comprehensive income base, noting that there are significant accruing gains that will largely never be taxed is quite relevant – and getting caught up on the fact that they are measured “at accrual” feels a bit like a deflection.
If the realised gain was taxed you would want to include the present value of that future liability when looking at accruing gains – as there is an accuring tax liability – otherwise the ETRs would risk being misleading. But that largely is not the case in New Zealand.
As a result, this concern is still relevant when saying that an “accrual tax” has issues. But it isn’t particularly relevant when investigating the average tax liability of individuals that earn a lot of income from capital gains – again remember, these are not taxed in New Zealand unlike most other countries.
Personally I find the income base weird to start with – and would look towards international recommendations for a progressive consumption tax and potential tax on inheritance.
But if you are happy with taxing an income base, I don’t see why you’d get wound up looking at accruing capital gains to understand ETRs when the realised gain is itself untaxed.
On inflation
A bunch of economists and commentators went wild about inflation not being included in the analysis, stating it makes everything junk. This is both an interesting point – which relates to my preference towards consumption taxes above – but it is also not nearly as important as is being stated.
Why does inflation matter here? Well income that is just “compensation for inflation” isn’t really income – it is a required return to maintain the true value of the asset. Haig-Simon income is in real terms, not nominal. As a result, not accounting for inflation does increase the income base.
However, the current tax system is based on the taxation of nominal returns to capital – as a result, we tax the entire nominal interest you earn from savings, or the entire nominal share price gain on foreign shares. In this way, a system that compares capital income items on a “like-for-like basis” is the version without inflation.
This is a larger issue for long-lived assets. And it points to a deeper issue about what is income from capital gains – namely if the risk-free rate of return declined during the period (it did) and this explains part of the increase in asset prices (it did) this is largely not income – unless it generates age based redistribution (Kaldor 1955, Fagereng etal 2022).
And the overall taxation of inflation is a big issue – Andrew Coleman has a fascinating paper about this.
But what is this:
The IRD paper does not, but is clear that it is doing so to make sure the related bases are treated consistently – and due to the complication of dealing with the life of the asset. My guess would be that such assumptions were probably forced on them in order to avoid making the questionaire too invasive about individual assets.
If we just took a rule of thumb where we substracted the inflation target from the reported nominal gains in the report (equivalent to increasing the cost base by inflation), the ETR rises to around 11-12%. If they had reported this would people be talking about how the report was a smoking gun about something?
No, because the real reason they disagree is that they don’t believe this is the correct tax base overall. That’s fine, but actually say what it is then instead of weirdly bagging people who explicitly and repeatedly told you what they were doing – and you missed it because you didn’t read their report.
You used to work at IRD, so you are biased
I did – more than that I worked with the team who was kicking this off while I was there, but have been over in Australia for a while now.
I do think highly of the people who worked on both these reports from my personal knowledge of the types of people they are. But deep in my heart I am an economist. If I had read these and thought they were political documents that purposefully ignored important shortcomings – at the behest of an activist minister/government/staffers – I would have no qualms saying it how it is. Hell, I’ve upset enough people I respect on this blog in the past because I can’t keep my mouth shut.
In fact, as I’m now in the private sector causing some mayhem by trying to pick at the report would be in my own interest. I don’t do this because the reports themselves are fine.
If you don’t trust the discussion above, I couldn’t really care much less – you do you. If you think I’ve missed important elements, or you want clarifications on things then drop me a comment down below or flick me an email – as I’d love to chat.
Can I give a preview to my thoughts on the reports results? They seem accurate and descriptive which has value.
- The real lifetime ETRs (relating to redistribution) are probably a bit higher than this for the high wealth group and lower for the general income earner due to the period analysed and the definitions,
- The comments around the media about the NZ tax system being regressive (i.e. with GST) are reading too much into this (and into how it reflects about fairness).
My hope is that the upcoming tax principles work is also careful about how it interprets these types of metrics. But these views may change on further reading, so we’ll see
I will read both policy reports in the future. I know both the policy teams well, they are smart, have integrity, and provide genuinely useful insights. And my interactions with OliverShaw have always been reasonable, so I’m sure that report is of interest also. As a result, I don’t have much interest in giving a knee-jerk reaction to anything until I’ve had a chance to read the work and to educate myself a bit.
The headline results from all the reports sound pretty plausible – my key concern is that people who aren’t the researchers might start talking about them without understanding what the numbers mean. And man, I don’t want to be one of those people!
How can I say all these different results sound plausible when they are all quite different?
Well, how about we chat about effective tax rates a little bit first to discuss how there are different measures – and why they are different!
I’m pretty into the topic (i.e. my studies, my hobbies) and for those who know me I have a more respectable brother who arguably gets even more excited when he hears about this topic. So it is something I enjoy thinking about and chatting about. Lets have a go.
Note: I have not read any of the reports that are online yet – so please don’t read these as comments about any of the work, as it will be out of context. They are comments about me being a nerd.
What is an effective tax rate?
What is a tax rate? People in the media will talk about how I’ll pay a tax rate of 39% if I’m earning over $180,000 per year – but is that the right number? What about tax I pay when I spend at the shops? What about when I pay local govt rates? What am I even paying 39% of?
Well, this 39% is called a marginal tax rate as it refers to the proportion of an additional dollar of income I would pay directly in income tax.
So it doesn’t count other types of taxes I’d pay. And it doesn’t tell me how much tax I’d pay on the first $180,000 earned during that year.
Now what does it look like when I consider the tax I paid during a year from some measure of the income I earned – that tax paid divided by the income earned is the average tax rate. If I was earning $180,000pa at work my average tax rate would be way lower than 39% – in fact using this neat tool it looks like it looks like it would be 28%.
An effective tax rate takes these two concepts and runs with them – it takes into account other bits and bobs of tax, and importantly it will count “government transfers” in some way – either as income or as a negative tax. Look we’ll come back to this point.
What is income, what is tax?
So what is income? Well that’s a pretty hard topic – income is, in principle, going to refer to what “people can contribute from” on the basis of the means they have. There are legitimate debates about people’s ability to contribute from some things that are called income – and personally I find it easier just to think about these topics in terms of consumption. But we have an income tax system, and so these debates are key!
Lets ignore them!
So we are thinking about contributions to government from some amount of income. There are three types of broad income concepts I want to think about here.
- Market income: The income people generate before they receive anything directly from government, or get taxed.
- Gross income: The income people are sitting around with before they get taxed.
- Disposable income: The income people are left sitting with after they’ve paid tax.
There are other terms, taxable income, adjusted gross income, capital income, labour income, imputed income. But for our purposes, who cares.
The first two (market and gross) are a base that we can build tax measures from. One thing that people get minced up on is that they hear “tax rate” and they think there is one measure to rule them all. But for different questions the relevant rate is completely different!
- Intensive work margin: Hey, I am thinking about work a slightly longer shift this week – what is my tax rate?
- Extensive work margin: I’ve been out of the workforce looking after my young child and I’m thinking about jumping into work – what is my tax rate?
- Redistribution of income: I’m worried about inequality in our society, and I wanted to understand how taxes and government spending is reducing this? Can I do this with a distribution of tax rates?
- Earnings period: I’m taking a big risk going out and building up my hairdressing business – and with COVID coming in and out my profits are going to jump around a lot – how does my tax rate compare to one of the hairdressers I hire over the 30 years I run the business?
Effective rates and the choice to do something … usually work
The first two are “financial disincentives to work” – the first one is a “marginal” tax rate (the effective marginal tax rate, or EMTR), the second is an average or participation tax rate (the EATR, or ETR).
For this we want to start with what people are receiving in the starting circumstance (their gross income) and talk about how much is taken away as a contribution (the difference between gross and disposable income). In the first case the person is working and works a tiny bit more, in the second case they aren’t working and jump to work a number of hours. We care about the two measures as they are refering to two different “choices” related to work – the decision to work a little bit more (intensive margin) vs the decision to move from not working to working (the extensive or participation margin).
The tax here refers to more than just the tangible tax contribution. It also includes any abatement of government support – or in english, the amount your benefits are reduced as you earn more income.
Here the tax rate is the ratio of (tax + benefit removed) divided by gross income. This is because this is the proportion of gross income that is sacrificed when you decide to undertake this other choice – or in english, if your boss pays you a given amount more, how much of that amount goes back to the government.
These types of disincentives can also be considered for a much wider range of behaviours – saving, investment, reporting of income – but work incentives are just a great example of how we’d use such a measure!
Effective tax rates and “fairness” – redistribution
The third is a wildly different rate – we aren’t asking about people’s incentives to work, but instead how taxes and transfers transform market income to disposable income. This one is more about “fairness” more generally. It doesn’t tell us what is fair (redistribution is a value-laden issue), but if we coherently want to talk about people paying their “fair share” we want to be building this measure – not the measures of financial disincentives to work.
This third one involves subtracting benefits from tax, and not including benefits in income to start with – so the “tax” is the net payment by the individual to government (tax – benefits) while the “income” base should be the “initial” market income in the absense of taxes and benefits.
The rationale is that this measure of the tax rate is representing the way the tax and transfer system transforms your market income which relates to how much is changes relative to that income.
The difference between disposable and market income is benefit minus taxes, and so the system has generated this by adding benefits to your income, and taking away tax. You “contribute” in a fiscal sense when taxes paid exceed benefits received, and you are “contributing” from the private/market income that is generated from transactions without the imposition of the tax-transfer system.
In terms of “contribution” it may be that many people are not net contributors, but that is by design – “market” incomes are not the demarcation of fairness, and the real question is then whether policy does enough (or too much) to address inequities that do exist in this distribution. In other words, there is no substitute for actually talking about the actual incomes and opportunities that people face and the trade-offs involved.
Furthermore there is a huge wrinkle in these definitions – behaviour. The market income distribution would look very different without taxes and transfers, and in this definition we’ve assumed it wouldn’t change. As a result, it is normally a bit more accurate to say that “the individuals involved in the transactions that lead to market income are contributing” rather than the sole individual who is paying the tax (to capture the idea of tax incidence) – but even then there are shortcomings related to behaviour and counterfactual activities. So we gotta be careful!
How do we get to this fairness measure?
Actually, this is a fun topic – so I’m going to dive into it a little bit.
Now there is a lot of debate about fairness and ETRs in the literature – and the literature often goes in a different direction. By definition the progressivity of the tax system is just a measure of tax paid from an income base, and gross income is a legitimate base to ask how progressive taxes are.
But this isn’t fairness.
If our questions are about whether government policy is “fair” we should be looking at all government policies together, and the way this redistributes income – any half measure of this just doesn’t really tell us anything useful. Yes you’ve stopped a bunch of people having a negative infinitey tax rate when you draw a graph – but you’ve also made your measure treat a dollar paid to someone and a dollar taken from the same person not equivalent!
Ok I need to explain this. Imagine we have a person earning $10. We then tax them $5 and given it back to them. What is their tax rate? If we only looked at taxes on market income it is 50%. If we added benefits in to get gross income it is now $5/$15, or 33%. But their situation – and any view about their contribution – is exactly the same as if there is no tax!!
Fairness is about asking about the change in an individuals situation due to the redistribution tax-transfer system – we then debate if this redistribution meets our “principles of fairness”. Looking at only one part of the system and ignoring the rest to make fairness claims is incoherent.
A “fair” system will redistribute between people based on a set of values – and so if we are using the tax rate to describe this we would want to treat circumstances where the individuals situation is unchanged in an equivalent way. This measure does not and so will give us different numbers for two policies that are exactly the same!
Now, if the goal is to try to look at taxes and benefits in isolation and talk about relative effects, then playing with a variety of income bases is sort of interesting! And if the goal is to comment on distortions in behaviour, and the $5 payment is happening regardless, then this is the damned right measure (hence why I’m using a similar definition here).
I’d even concede that we might have fairness concerns about sharp benefit abatement and poverty traps- which may be easier to understand by looking at the financial disincentive measure.
But if the goal is to comment comprehensively about fariness of the overall tax-transfer system through redistribution, we want to use market income as the denominator and subtract transfers from tax, to ensure we compare policies consistently – by looking at the net amount redistributed to the individual/family as a proportion of the initial (market) income. Anyway, if you are interested read this cool paper (Herault and Azpitarte 2015).
And before anyone swings to the extreme of saying “over 50% of people aren’t net contributors, that is unfair, lets cut taxes” let me give a clear response – yawn. In a world where significant value is generated from the technology and the knowledge we share, it could easily be the case that the “fair” distribution involves even more people being net contributors – and the argument you are making is as incoherent as the situation described above.
To do a fairness comparison we really need to ask “how does the observed contribution compare with how it should be according to our fairness principles”? For this it makes more sense to actually report the distribution of income, and counterfactual distribution if policy was different – what are the outcomes and opportunities for people on the basis of a tangible policy change.
Lifetime contributions
The fourth could be about either incentives or fairness as the person didn’t tell us – but we would want to think about it in a lifetime basis. In New Zealand we don’t tax capital gains (meaning there is income that doesn’t get taxed for the owner in so far as they spend their own time building up the business and goodwill) but we also have a progressive tax scale which taxes “variable” incomes more.
So here, should we be taxing capital gains? If so what part, do we tax inflation? Do we tax the “risk-free return”? If profits are taxed in the future are we double taxing now? Or are we just taxing the bit that is hidden labour income and economic rents?
Hells if I know – the main thing is that if we have a lifetime perspective of the net contribution to government from market income, some of this will wash out, and some important parts will not.
As a result, any discussion on effective tax rates – especially at the top end with a lot of “capital income” – will need to have a discussion of this time dimension. This is where stuff gets super fun – and where we’ll leave todays yarn!
]]>In the lead up Simon Chapple has posted a good article on the issue, and I’ve posted up my own article as well. This is a major policy proposal that is being pushed through under de facto urgency without a proper policy design process – and with lots of unintended consequences. As a result, even though we both agree with looking at improving support and transitions for individuals facing hardship – in fact this is an issue we have both focused on in the past – this ain’t it son.
For those who do not want to trudge through text, the thoughts can be boiled down as follows:
Unemployment is a hard life shock, and there is benefit in both sharing the cost of that shock between us and helping people transition back into work. But this suggestion:
- Goes a lot further than just helping those at risk genuine hardship from this lifeshock – and is much much larger than schemes overseas. [Those that say NZ is just “catching up” with this are just directly lying]
- In its current design it will be regressive across most of the wage income distribution – with single individuals and sole parent beneficiaries disproportionately contributing.
- Will cost more than suggested.
- WIll be subject to abuse by those who are able to organise sham redundancies and sham jobs.
- Is likely to give bad employers more power over their staff.
- It creates an “alternative” to the unemployment benefit that will reduce support for the most vulnerable.
It is worthwhile to look in this space, but slow things down and work through the policy design issues – and actually look into some alternatives to achieve the policy goes.
ACC took nearly a decade to get set up and legislated, with it mentioned as an election proposal. The 1938 social security act was designed with feedback from experts, debate on alternatives (which is why we didn’t end up with income contingent payments then), and decades of prior system design – and then it was taken to an election before it was implemented.
I’ve heard on the grapevine they’ve already started hiring staff to implement the income insurance scheme as they want it legislated and underway before the election – implying this consultation is non-genuine, and we also don’t get to vote about it. If this is true then Ministers are putting their own determination to look progressive ahead of ensuring that good policy is put in place – which is very disappointing.
To be frank, this is absolutely scandalous – and even if the policy proposal was well designed (which it is not) this would be terrible. Hopefully what I’ve heard is untrue, but if this comes to pass then we should all be very disappointed in this process – and the unavoidable harm that will come from the poor implementation that will follow.
]]>The last time there was a 50bp increase was May 2000. If you want to understand what was going on there take a look at inflation and the exchange rate during that period – a drop in the dollar was stimulating activity while inflation was high and climbing, so the Bank responded.
The exchange rate isn’t doing that now, but the world (and NZ) opening up post-COVID is filling that role – while core inflation is high, and headline inflation is at levels a lot of people have not seen before. In this way, the Bank is tightening – makes sense, and I trust they’ve worked it all though.
Ok, you have an angle here right – you always complain
Hmmm, there is one thing I was wondering. Tightening isn’t all about the cash rate, in the same way easing wasn’t all about reducing the cash rate – there was quantitative easing so where is the quantitative tightening (QT)?
This is a big issue overseas. The BoE has been signalling about it for a long time and discussing it in minutes, while now undertaking it. The US Fed is also undertaking it.
The RBNZ has announced adjusting their LSAP portfolio (which they’ve also well described here) through sales to NZ Treasury, but it has explicitly said it wants to do it in a way that doesn’t reduce monetary stimulus.
I don’t quite understand this. The BoE noted that it is using cash rate “triggers” to reduce its portfolio – ie. once the cash rate is 0.75 they start easing QT as at that level the liquidity rationale for the balance sheet intervention is largely gone. Once sufficiently unwound they return to increasing cash rates.
There should be some “equivalence” on the monetary stimulus side – where a given path of reductions in the size of portfolio holdings refers to a certain type of adjustment in short-term interest rates. In that way it would be useful to know what the “cash rate offset” associated with QT is, and to communicate that QT is indeed part of tightening monetary policy.
I don’t understand why this is explicitly being ruled out as a way of reducing stimulus – especially when other central banks are saying the opposite. However, this could just be me being dense – so if anyone has an explanation I’d love to hear it
Side note
For economists out there – getting the balance sheet down is important for appropriate central bank independence, both from government and from the financial sector they are regulating.
Monetary policy should be an “offset” to other things hitting aggregate demand, that only has eyes on inflation and other demand related signals – taking more and more influence from government or retail banks about the amazing things they can do and intervene on leads to a situation where policy starts to favour these vested interest groups.
The lack of symmetry about the discussion of QE and QT screams to me that there are specific concerns from either government or New Zealand retail banks that might be influencing policy in a way that varies from this – and the Bank should stand up to that.
]]>I’m a trained economist. And I’ve been working in government in New Zealand fairly recently, and am now actively employed in the private sector. So do I have juicy gossip?
No, not at all. I do have a perspective however that isn’t just about some arbitrary lack of hiring “well trained economists” – lets have a chat.
Tl;dr
For those who don’t want to read me go on a meandering journey the cliff notes are:
- Bureaucracies respond to incentives – based on funds available and the type of advice demanded. So we can only understand this based on demand.
- Ministers and public commentary determine what the demand will be.
- Ministers need to appreciate these trade-offs are complicated, and invest in properly understanding them prior to making decisions, instead of rushing policy through.
- Public “thought leaders” spend too much time talking about vision and too little time pointing out the trade-offs. This is where the true “economists”, which are about informing rather than telling us all what policy to pick, are MIA.
- So instead of attacking the middle-person, subject matter experts need to get out there and communicate what is missing from policy debates – while Ministers and their offices need to learn some humility about what they know, and what it requires to generate knowledge about the true consequences of policy.
Tell us about yourself and policy
No. I’m sure if you use google you’ll figure out where I was working, and I had plenty of opportunity to work with analysts across government on economics issues – and I worked with a lot of insanely thoughtful, intelligent, and passionate people. If you find out where I worked, note that I hold these people in high regard.
Furthermore, when it comes to doing policy, describing trade-offs, and understanding the specialist nature of the subjects we were discussing there was no way I would have thought having significant economics training alone was sufficient. When I was working in this space I was constantly learning from other non-economists, and simply having more economists around itself would not have improved that – I’m not the flashiest economist in the world, but it isn’t necessarily a lack of economists that is the constraining factor on the advice.
Yeah, in broader government there were and are people who say dumb things about economics and try to discredit objective analysis across government – those are called human beings, and that has always happened and always will. However, the language of economics is still seen as a good and transparent way of describing issues.
And if you are one of the bureaucrats that doesn’t believe economics is needed to give policy advice, and likes to say dumb things about economics (i.e. suggesting we don’t look at economic research as its all discredited) – you don’t come off as a free thinker, you come off as an arrogant idiot who wants to fit into “fashionable circles”. Either grow up and learn to give policy advice that clearly identifies trade-offs, and so is self-aware enough to see if the policy choice hurts people, or get the hell out of policy and find a job where you won’t hurt people anymore.
Anyway I digress, what is the role of a bureaucracy? Operationalising and administering policy and acting as an active policy Wikipedia service to Ministers to help them understand trade-offs. For the later a core amount of economic knowledge is required, and most large agencies have a team that has some economics training to do this – and a research or analytics unit that provides further insights.
By its nature such work is almost always reactive in a small open economy, as we lack scale. It is impossible to analyse the trade-offs from every possible policy. As a result, what is being discussed in public and what is raised by stakeholders in consultation (including a Minister) will constitute issues to focus on. Things get more complicated sure, but this is the gist.
Demand for advice
So the concern appears to be that advice is done too quickly, and by people with insufficient training – leading to cherry picking of research, missed trade-offs, and ultimately policy advice being given that’s inconsistent. I of course can’t speak to that given the impeccable nature of anything that I was involved in – more seriously though, lets think about this.
The advice provided will depend on the resourcing available and the underlying demand for advice. During COVID pretty much every bureaucrat I know worked around the clock under ridiculous time pressure – not just because of COVID but because of demands to provide advice on any transformational policy that was dreamed up. At the same time there are constant public complaints that there are too many analysts – with some ridiculous pipedream that somehow people will be able to produce more higher quality advice with less support.
The high quantity, low quality, public discourse in New Zealand when it comes to economic questions drives this. And when, to quote an unnamed journalist “we should write all economics as if it is being read by an 8 year old” the consequent quality of the public debate does not put genuine pressure on Ministers to demand higher quality advice and invest in it.
In this environment a highly trained economist is not the sort of resource that really works well – research economists are thoughtful, engaged, argumentative, and slow. I’d know, as I am one (even if the thoughtfulness is debatable).
So when the policy advice that is demanded is high level, cursory, and fast it is entirely consistent that bureaucracies will not be hiring “highly trained economists” – they will bloomin hire people that can get the work done.
If that is the nature of things, then having external trained economist available to hire in for detailed work can be a solution – and my understanding is that is often how these things work. But for this to happen you need to know who to bring in. And to find the resource to bring that in there has to be the underlying demand for it!
What’s the solution
Nothing will change unless, to be frank, Ministers become embarrassed by their own incoherent knee jerk policy settings.
Do Labour party Ministers and their office staff think policy setting by poll makes them seem like pragmatic world leaders? Do they expect establishing rushed poorly thought out policy will lead to their statue being placed outside parliament? Do they take pride in ignoring the trade-offs associated with their policy, and the way that unintended consequences usually fall on those most vulnerable in society?
I know this isn’t your intention – but by rushing the policy process this is exactly how it looks! In this way, for the vast majority of people in politics who are genuinely interested in outcomes, the important thing is this – policies have unintended outcomes, and a big part of the process is investing is spotting those to make sure we aren’t hurting people we don’t intend to. The reforms of the early 1990s are seen as bad now, but at the time the rushed nature of that advice was not pointing to the harms we can now see!
For the smalIer number that see politics as a game – stuff off. Rather than turning the sprinklers onto a policy problem and making it worse, recognise that making a genuine difference requires genuine investment in services, and in genuine data and policy infrastructure to make informed choices about the nature of these services.
Stats NZ is underfunded to the point of embarrassment. Compared to other countries we run our tax and welfare system on the smell of an oily rag. And the short-termism, and frankly undemocratic ramming through of policies under emergency legislation, undermines the quality and consistency of the policy framework in New Zealand – leading to a gradual erosion in people following the “intent” of legislation and the law, and eroding trust.
Of course, I don’t want to be overly harsh – it is clear that many Ministers do genuinely care about outcomes – but expertise matters, and trained economists are trained at describing these trade-offs. Demanding the same level of analysis overnight from an overworked and understaffed bureaucracy is a ministerial failure.
But if this is true, then it should make it easy for independent economists, at university and the private sector, to tear holes in advice right? So where is this?
The culpability of economist “thought leaders”
When a large number of “independent” economists and commentators appear to fawn over every “pragmatic” “strategic” “masterstroke” of a policy choice it is easy to buy into the hype. After all, if Archimedes can discover things in the bath then what is the issue of making policy in the same way.
Eric is a good fella who speaks truth to power – we need more Erics. But where are the New Zealand economists when it comes to communicating the economic science of trade-offs from policy choices?
Why do many of the consultancies feel so compelled sell us their “vision”, or to give government credit where none is due on the basis of vibes (although a shout out to my old buddies at Infometrics for being willing to call things out, and the NZ twitter economists who I also see keeping thing real).
Buddy, leave the vision stuff to politicians – they are better at it – can economists just inform us on trade-offs by explaining and quantifying unintended consequences!! Stop using the economist title to tell me you have a vision to increase productivity, improve housing, save the whales, and remove material poverty without any consequences – when you do this you are an advocate. There are always trade-offs, and what is constantly missing is the description of those.
I know if feels nice to show everyone that you can save the world with your great and grand vision, and gets you lots of attention – but if that is the game you want to play, stop calling it economics.
Now I don’t want to be overly harsh here, especially as I know I’d be the sort of person that would easy start doing the same thing (largely on poverty and inequality) – I recognise that this advocacy cares from caring about the issues, and caring about issues that do matter. But remember we all care about issues, and offering a compelling vision has it’s place. Most of the time what is missing is an economic description of trade-offs, not an impassioned advocate.
Framing it this way, I think it would be unfair to even criticise those who are publicly talking about economics now – they talk about trade-offs where they can, and play advocate on issues they care about.
Instead, where the hell are the real descriptive economists that can arm the rest of us with facts – and allow the rest of us to then debate what we value given the information they’ve provided.
We’re all allowed values and to care about things. But the economic expertise that is being discussed is in the ability to describe trade-offs from a policy choice – and surely an academic or industry economist who is focused on the market that is hit by the policy choice is best placed to communicate that.
Let’s be real. We don’t need people with the economist job title running around telling us what the “best policy” is – New Zealand is already massively overfilled with these people. We need people willing to apply the economic method to appropriate policy questions in order to understand trade-offs and inform policy makers and the public – with all the framework and data analytics based work that requires.
So you are blaming the private sector for public sector hiring
Only partially, the cavalier attitude of Ministers towards the time and effort required to give good advice is also very much to blame – but the lack of descriptive private sector commentators deserve more critique than they are currently getting. So I’ll do that here.
You may have noticed this concern in my recent posts – the only place with worse communication than the RBNZ at present is the business and economics media.
I’m from a different time, a time where consulting was about talking truth to power – when Gareth Morgan would call a spade a spade prior to his foray into cats and politics. I often disagreed, but the act of pointing out and unintended consequence and making people think about it was damned valuable. Discussion of a policy wasn’t based on who suggested it and how it fits within a horse race narrative of politics – it was instead a discussion of the merits, and costs, of the bloomin policy. And even when you didn’t agree with his conclusions, there was always a descriptive framework that allowed you to understand why – and why you might see things differently.
You might be cynical about my perspective as I’ve just said I’m in the private sector. I’d think the same, this sounds like branding. But I’m not working in New Zealand anymore, all my work is in Australia on Australian issues – so there is no benefit to me in discussing this. I just care about New Zealand a lot, and I want to see New Zealand be the best damned country it can be – protecting the vulnerable and while supporting voluntary exchange and positive community spirit.
This requires real transparent discussion of trade-offs from policy choices, and that has to start with open and honest discussion by people that understand these issues – the subject matter experts that are floating about outside of government. For many policy questions which require the government and public to make a choice knowing the trade-offs involved, economists do fill a key part of that.
So what is all of this saying – instead of slamming the bureaucracy for not hiring enough economists, maybe we need more subject matter experts (i.e. academic economists) taking an active role in explaining what is wrong when a discussion document is released. And to do that, we need Ministers to give genuine periods for consultation which would allow such people to build up their arguments. And a media that is willing to run with this type of expert communication.
Attacking a bureaucracy that is filled with capable people, but worked to their limit, without offering a solution doesn’t help – it infact misdescribes the issue, has a poor problem definition, and leads to incorrect conclusions, failing the very standards that people are being criticised for.
Economics is beautiful – if economists feel that the bureaucracy is underusing it then lets all get together and show them just how awesome it is at helping to describe policy issues, and how dangerous it is to do policy on rhetoric without an eye to unintended consequences.
]]>The comments below the article fundamentally think I’m misguided – and that the Bank has dropped the ball more fully. Blanchard also has an excellent post on the US case which may be also be used to be more critical of the policy operation of the RBNZ.
Although I am constantly misguided and wrong, there are two things I would raise here to defend my own position:
- With external shocks there was always going to be an “income loss” – fiscal and monetary policy determine how this is distributed. The Bank can’t make this type of “cost of living” crisis and related loss go away – it can only ensure that the transition back to their clearly communicated inflation target is “least cost”.
- Criticising communication is a big critique of the RBNZ – managing inflation expectations is their core job.
There is no point bagging an institution for things that are not their fault – but more transparent and clear communication about monetary policy, instead of every other issue that the Bank seems obsessed with at the moment, is needed. The current lack of communication about narrative/forward looking guidance about how the mandate will be achieved, combined with forecasts that arguably point to a general failure of the mandate, is a problem. If this type of failure doesn’t lead to changes in how monetary policy is communicated in the current environment, or lead to a situation where the responsible people at the RBNZ face consequences for this failure, then inflation expectations are going to become unanchored.
And I would argue that the nature of the comments on my interest.co.nz article indicate that people’s faith in the RBNZ to manage inflation expectations is frayed – and their reaction reinforces the importance of the very communication issue I am pointing to!
If you feel compelled to attack the Bank further or launch into an impassioned defence, then go for it in the comments. I just want good policy communication and evidence-based policy that supports the wellbeing of New Zealanders – something that both the Bank and private sector commentators have a responsibility to up their game on, given the quality of the current discussion of New Zealand’s “cost of living crisis”. (Noting that a number of NZ economists – as shown in the comments of this piece – are trying to clarify what is going on)
Fiscal policy itself matters here, and clearly understanding the trade-offs associated with fiscal policy choices – at a minimum through the necessary monetary policy offset, but also through the distributional implications and consequences on growth and productivity – is another important area for discussion. Let’s leave this for another time though.
]]>The New Zealand government has decided to cut fuel taxes and RUC due to the “cost of living crisis” in New Zealand – egged on by the opposition and a range of New Zealand thinktanks and “thought leaders”. When a similar spike occurred in 2008 such a suggestion would have been ridiculed for being the ill thought out and incoherent policy it is – now it is the sort of stuff that gets a cross-party consensus and loud repeated cheers from the tens of New Zealand Twitterazzi.
Honestly, what is wrong with policy debate in New Zealand – when did we go from caring about policy outcomes and trade-offs to treating every policy decision as something that must be done urgently as if we are in the middle of an episode of West Wing. I mean, read the analysis in the two front-page articles on Stuff (here and here) – it is all politics and no consideration of trade-offs.
Want to understand why I see things this way – click the tab and read on.
What are these taxes in the first place?
The excise tax and RUC that have been cut are a fee that is intended to pay for costs imposed due to the consumption of fuel – be it a reduction in the quality of the road, environmental costs, or other potential negative spillovers from road use. In this way, the purpose and intent of these taxes is to ensure a user-pays device for road use – and ensure that individuals internalise these costs when making their choice about fuel consumption.
In so far as these taxes do represent these costs, then any reduction implies that individuals do not face the full cost of their decision to consume “the road” or “fuel”. As a result, they will tend to consume more of this item then if they faced the full cost, and the cost of that is bourn by others – the general taxpayer (and non-fuel consumer) who will have to pay more through higher taxes, the individuals that experience higher environmental degradation in their community etc.
How these costs are allocated may be complex and opaque, but if this was truly an externality tax then these costs do exist – and if its not, there is a question about whether the tax should have been there in the first place. So I’ll take it as given that it was at the right level.
The rationale for cutting the fuel tax – distributional concerns
The spike in energy prices due to rising global demand and the Russian invasion of Ukraine reduces the real income of those who consume a lot of energy by more than those who consume little energy.
If this was perceived as unfair, there could be a justifiable desire to support those who are more heavily hurt by the spike in fuel prices. In this way, a cut in fuel taxes feels like a natural solution.
But lets think about this a little more. The spike in fuel prices is occurring because fuel is more scarce – the increase in prices tells us that this item is more scarce and we should ration it. As a result, the higher price is a mechanism for incentivising the reduced use of fuel at a time when it is more scarce.
Removing the tax arbitrarily blunts this mechanism – and as noted in the discussion about the rationale of the initial tax, it does so by simply making other people who are not consuming the fuel pay part of the price of it.
Furthermore, alongside other policies that are trying to price the externality associated with fuel consumption this policy is directly inconsistent – you can’t increase the price and cut it at the same time. Flicking together inconsistent policies that push a price in opposite direction will simply lead to wasteful expenses on bureaucracy and avoidance while achieving nothing.
If we could observe people who have previously consumed a lot of fuel, and if we knew they would have continued to consume a lot of fuel in the absence of the price spike, a better solution would be to send these people a direct deposit for some sum of money and leave prices as they are.
Now we can’t observe that – and it also might not be the distributional concern that we as a society care about. After all someone with significant wealth or income may be able to more comfortably weather an increase in costs (or substitute between activities) than a low income individual. However, what we could do is ask ourselves who is made vulnerable from the spike in fuel prices and ensure that they are supported.
A focus on protecting those at the bottom, rather than trying to generally prevent prices from changing, means we don’t need to ask questions such as “is a fuel tax regressive” (Poterba 1991 is quite interesting on this issue) as it is only part of a package – it just means we need to consider the costs faced by those in the most precarious situations when providing appropriate income support.
The spike in fuel costs is not without historic precedent – however the level of price inflation without wage growth (and thereby the decline in real labour income) is. This also indicates that the issue is broader than fuel – the concerns people have come from facing rising prices in general, which are indicative of the productive capacity of the economy being below current demand for goods and services. A period of lower productive capacity following COVID, and given the constant interruptions overseas, is how it is – and arbitrary changes of individual prices won’t help that.
What to do?
Instead it is questions about the nature and magnitude of government income support, and the related change in monetary conditions that this requires, that determine who is bearing the burden of this income shock. And policy work, and responses, should be focused on that rather than trying to fiddle with the price of individual items.
For those of us in the rest of the wage earning distribution, questions about our next wage round are more live than ever – implying that we need good guidance on where prices could go from here, and to keep an eye on what job opportunities are available if we have an employer who is unwilling or unable to compensate for higher prices.
For economists, if this is a supply shock the appearance of rising wage demands starts to look like a wage-price spiral, where higher wages increase costs, increasing prices, requiring higher wages. The current dynamics is a bargain to try to split the loss of an income shock between capital and labour – this provides a challenge to monetary policy, but it also seems inappropriate to ask wage owners to sacrifice their share of income unless capital earners also are.
The solution for this is monetary policy that appropriately balances demand and productive capacity to manage inflation expectations. Contrary to prior comments I’ve made, NGDP targeting, by providing a clear communication of nominal income over time, does have appeal in this circumstance.
We can’t change monetary regimes, and would need to do more work if we did! So is a fuel tax cut a targeted second best for middle income earners to manage this? No.
As noted above, the price spike represents scarcity, higher general prices are the real issue, and the current wage bargain involves workers and employers distributing the genuine income loss that has occurred.
Fuel tax cuts in this context change who is paying for the externality from the user to other people, distributing the loss to those who don’t use much transport or who are subject to environmental costs.
Furthermore, if they reduce wage demands the benefit of the cut goes to employers – limiting its ability to provide both cost of living relief and limit inflationary pressure. Although, to be frank, it would do little of either.
Conclusion
Lets get real. The world is complicated and sudden changes in prices tell us that something has suddenly become more scarce or less scarce – and that we need to adjust our spending patterns at that time to compensate.
To the number of people reading this who are fired up due to how the fuel prices are affecting you as a “middle income Kiwi” – you are not in a precarious situation and have been insulated from the worst of COVID. Having to take a holiday a bit closer to home due to the cost of fuel is not the end of the world, and it is not the responsibility of the government to make sure you can spend a bit more time in your holiday home. You might find people pandering to you everywhere else, but not here.
Instead good government policy would support those who are most vulnerable – not necessarily those who are most affected – and if it was relatively long-lasting it may support the transition.
With indexed benefits and minimum wages this support of the most vulnerable is already happening.
Meanwhile, the excise and RUC changes do neither and instead shifts the cost of increasing scarce fuel onto those who are not consuming the fuel.
Worst of all it opens the door to increasing arbitrary subsides based on political expediency – with the harder to observe costs seen as acceptable for politicians to keep themselves in power.
If this blog goes out and there aren’t a series of articles and interviews up with New Zealand economists calling this out for the incoherent political opportunism it is, then it isn’t just the political environment that is to blame – it is the unwillingness of New Zealand public facing economists to describe and discuss the simplest policy problems in a way that might be unpopular with the government of the day.
]]>I’ve heard it all.
However, it made me realise something. I haven’t looked at the details of the CPI numbers for years. If the situation has changed then my inattention to these numbers may lead to me making silly decisions. Furthermore, other people’s attention to these numbers may make inflation more responsive to the CPI releases – meaning that there is more value in me paying attention.
Given all of this, and given that I wanted to reacquaint myself with the new version of the Stats NZ website, I’ve put together an excessively long video exploring the CPI data at the “product class” level. In it I also have a look at some price stickiness measures, looks at some other inflation numbers, and fail to put particularly nice labels on scatterplots – this can be found here.
If you prefer 4 minute summary videos instead, then I run through the key ideas in 3 graphs here. And if you prefer to get your own hands dirty with the data, rather than listening to me drone one, jump over here to use my R code and access Stats NZ’s data.
Do I reach any exciting policy conclusions, or give a forecast of where we are going in any of this – no. Did I have fun, and feel like I have a better understanding of the type of shock New Zealand is experiencing at the moment – yes.
By the way, the three images I chat about are below – in case you’d rather just look at them rather than hear me drone on (fair). Data source is Stats NZ.
]]>


For those who don’t like videos, there is a transcript below.
[Matt]
Gulnara has told me I need to get a haircut.
I’ve selected the place I’m going to go due to their good and reliable service. But something I did notice is that, everywhere I looked, the cost of a haircut is a lot higher than when I was young.
Now there has been inflation – or a general increase in prices – during that time. But this doesn’t quite cover it. Looking at the CPI category for personal care – which includes haircuts – the prices have gone up 52% between 2006 and 2021 while the average price of consumer goods as a whole has risen 37%.
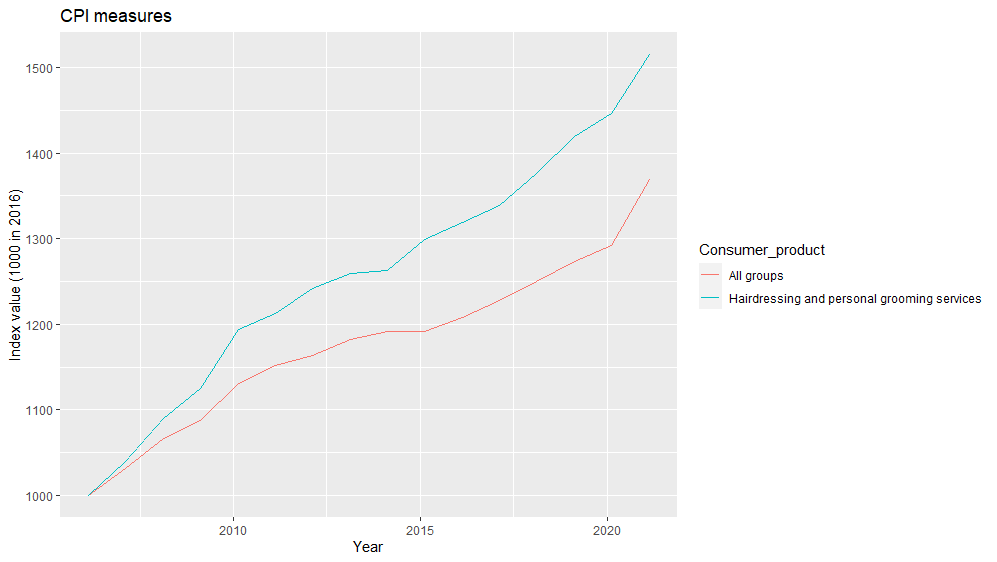
So to solve this puzzle I thought I’d call out to my favourite economist to see what she has to say.
[Gulnara]
We have all seen this graph from the United States [Vox graph]. This shows that the issue Matt is chatting about isn’t just about his haircuts – which are necessary by the way – but also refers to a wide range of different products.
Payments for services, such as college fees and medical care stand out as items that have become relatively more expensive.
Meanwhile durable goods, such as cars, furniture, and toys have become relatively cheaper.
As the economy has matured and grown, different needs and wants have been met, making room for different avenues for scarcity.
Growing global trade, along with technological progress, has helped to increase productivity across a range of sectors. However, even those sectors that have not seen productivity rise – and who have not seen relative demand change – have been influenced by this, due to the interrelationship between industries.
No matter how much we look at different sectors and industries separately, they are all bound together by a complex web of related demand for inputs – especially through shared labour and capital markets. And it is only by considering those that we can think about Matt’s haircut.
However, answering Matt’s question doesn’t just tell us about haircuts – and it doesn’t just tell us about long-run economic history and economic development – it also helps us to understand some of the things going on, right now, in the COVID afflicted global environment.
As a result, understanding Matt’s haircut might help us to think about the risks and opportunities of the post-pandemic economy.
So let’s get this started.
Baumol effect
In the 1960s economists noticed something funny going on with the price of different things. The 1966 paper “Performing Arts, The Economic Dilemma: a study of problems common to theater, opera, music, and dance” by Baumol and Bowen looked at this issue specifically with a Beethoven String Quartet.
Now we can all understand the beauty and value of listening to a rendition of Moonlight Sonata. And seeing such a show live is a beautiful thing.
In fact, let’s play a bit of Fur Elise.
Enough of that, back to economics.
The quality and quantity of such performances has not really changed through time – there has been no productivity improvements in the provision of Moonlight Sonata performances.
And yet, the salary of a musical performer is now higher than it was in the time of Beethoven – in fact salaries keep rising each year (An Updated Look At Top-Tier Musician Compensation 2016 – Adaptistration).
If productivity is not rising in the classical music performance sector, why are wages rising? The key point here is that individuals have skills that are transferable between jobs – which means they can perform different tasks in jobs across the labour market. Although it is unlikely that a Cello player would go into a car factory to play cello, they would have skills to undertake some of the tasks within the factory – and could be trained on the job to do others.
As a result, if the Cello player only received the same wage as someone in the 19th century it is likely they would decide to work elsewhere – such as in the car factory where productivity has increased markedly.
Here the ability to automate, innovate, or increase the amount of capital in “capital intensive” sectors such as the car factory, helps to boost labour productivity. Meanwhile the labour intensive “productivity fixed” nature of the orchestra does not see labour productivity rise for that job.
Wages will rise in sectors where labour productivity rises. This increase in wages will lead to upward pressure in other sectors, pushing up wages even though the labour productivity in that sector has not risen. This will in turn force firms to shut down or to increase prices – and if consumers armed with higher wages were willing to bear those prices, we could well end up in a situation where we are now. A situation with musical performances continuing, but at a higher price and with higher wages paid.
Baumol cost “disease” refers to the Vox graph we noted earlier – it is the application of the Baumol effect to prices. However, the disease makes it sound like these higher prices are fundamentally a bad thing. You will hear “we used to make these things more cheaply, why can’t we now!” or “it gets made so much more cheaply overseas”. Well if it was just due to the Baumol effect, it is because the average wage rate in the economy is higher because average productivity is higher!
This is not to say there can’t be regulatory or competition related barriers that create issues. But rising prices and wages in these “fixed productivity” sectors that are reliant on labour intensive work can just be a product of everyone benefiting from growing productivity – hardly a disease at all.
[Matt]
Balassa-Samuelson
Thanks Gulnara.
On top of this, in the 1960s some macroeconomists you may have heard of – Bela Balassa and Paul Samuleson – were interested in why consumer prices tend to be higher in countries that have high average incomes, an empirical regularity that is termed the Penn Effect.
In this instance the puzzle exists because of the law of one price – the idea that in a world with open and free trade, consumer prices should be driven down to the same level across countries.
However, this need not occur, as it is costly to transport certain goods and services across borders. Specifically, we may view some goods as “tradable” because the transport cost is sufficiently low while other goods and services are “non-tradable” because these transportation costs are high. My potential haircut is an example of a non-tradable product, where getting a haircut in the United States would involve quite a significant amount of time and expense unrelated to the act of cutting the hair itself!
The law of one price would suggest that prices are only driven down in relation to the transportation cost – and so there should be more convergence in prices between tradable products than there is for non-tradable products.
Rising trade and increasing productivity in tradable sectors have helped to push a convergence in global prices for tradable products – and have also generated productivity increases, and in some circumstances terms of trade increases, for a variety of trading countries. Increasing tradable sector productivity has then resulted in rising output and incomes across the world.
But how are non-tradable prices determined? At face value non-tradable prices are determined by local demand for the product. So if average incomes rise, due to an increase in productivity of the tradable sector, there may be increased demand for these local products which will bid up their prices.
However, as was the case with my haircut or the music discussed above, demand can only take us so far. If there is domestic competition then, even though people’s willingness to pay in the tradable sector is higher, entry to the market will see prices decline to their prior level.
Instead, the key driver of the Balassa-Samuelson effect is the Baumol effect and wages. An increase in productivity in the tradable sector translates into higher wages. Higher wages in that sector give individuals who are working in the non-tradable sector an incentive to change their jobs – driving up the wage rate in the non-tradable sector. The higher costs in the non-tradable sector are then passed on in higher prices.
In 1989 Rudiger Dornbusch took this a step further and noted that the nature of demand changed as countries become wealthier, with demand for services increasing disproportionately EconPapers: Purchasing Power Parity (repec.org). Such an income effect can further reinforce these changes, and reinforces the way tradable sector productivity shocks are distributed across an economy.
Combined with the Balassa-Samuelson effect, this Dornbusch result tells us that income gains associated with increases in tradable sector productivity may be weaker than suggested by GDP comparisons at market exchange rates. However, it also indicates that such gains are distributed much more widely across the economy, rather than just where the productivity increase occurs.
This can be seen in prices – as shown on this tweet. Durable goods – which by definition are things that can be stored and so are usually tradable – have not grown in price as quickly as services for a long period of time. That is until the pandemic hit, pushing up effective transportation costs!
With parts of the service sector becoming increasingly “tradable”, the Dornbusch result of rising demand for services may also not remain a driver of the Penn effect going forward – if my income goes up I do not buy more haircuts, but I might buy more subscriptions to news services. In that way, increasing divergence between tradable and non-tradable prices and their relative productivities will need to be due to the Balassa-Samuelson effect itself.
So how does this relate to Matt’s haircut? [Conclusion]
Pulling these ideas together, we have not seen great technological innovation in the type of haircut, Matt gets over his long life. But we have seen innovations and productivity increases in tradable products, with greater productivity in New Zealand exports as well as higher relative prices received for those exports.
The productivity lift implies that there is more income overall, and part of this income is then allocated to those providing haircuts! As a result, the lift in haircut prices is a sign of growing productivity in other parts of the economy.
It could be that there are other drivers – namely regulation or competition – but such a change could also be a symptom of a healthy economy. Rather than a disease that we need to do something about, it is just a natural sharing of the benefits of growth.
So let’s go get Matt this haircut, and we’ll see you again next time. Byeee!
]]>