A decade without recession as monetary policy failure?
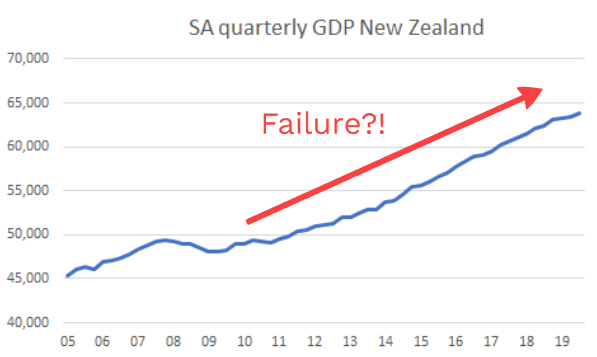
A post by Scott Sumner said that a decade of growth in the US wasn’t good enough – and was a monetary policy failure. In New Zealand, we have had nearly a decade without a technical recession (the last one was the second half of 2010) – so has this been a monetary policy failure too?
Sumner’s view was that monetary policy can be effective – but the Fed and US economists were acting as if it was not, and were thereby making policy too tight. As a result, even though growth occurred it was too slow and showed up in low inflation and high unemployment during the last 10 years.
The US central bank, and related economists, kept acting as if persistently low inflation outcomes – and to some degree high unemployment – were factors the central bank has no control over as interest rates were near zero. However, this has two problems – there are other tools, and they did start to raise interest rates while Sumner’s view was that conditions were too tight. In this regard the Fed should have been more accommodative – and the slow recovery and economic and social loss for it is their responsibility.
The question I am asking in this post is “how much does this argument hold for New Zealand as well?”
The New Zealand case
Sumner’s argument is based upon a view that metrics indicated that policy had been too tight historically – and more should have been done to boost activity by the Fed. The metrics aren’t really mentioned and he talks against the Phillips Curve relationship, but I will use that type of idea to understand where he might be coming from.
Specifically, he still views that there is an output gap that is not being satisfied in some sense by policy. So let’s look at two forms of metrics to judge success:
- Inflation outcomes, and relating labour market measures;
- The level of Nominal GDP (NGDP).
Inflation, labour cost inflation, unemployment
These are inflation targeting central banks, so the question is “how did the RBNZ do at meeting their inflation target”.
Let’s look at three graphs – growth in labour costs and prices, the unemployment rate, changes in unemployment relative to changes in labour costs.
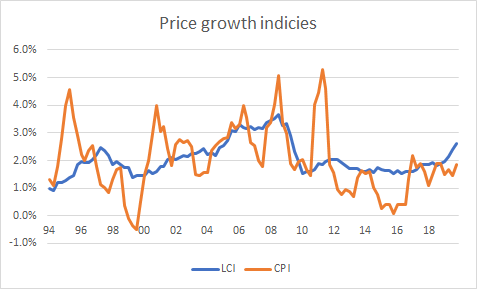
Let’s look at the bumpy series that is annual growth in consumer prices (the CPI). After 2011 (and the GST hike based spike) inflation was below 2% until well into 2016 – in fact it undershot the bottom of the target band (1-3%) during 2016!
New Zealand is a small open economy exposed to tradable goods prices. As a result, a drop in commodity prices was a big driver of falling inflation in 2015/16 – but other inflation measures suggest that wasn’t the whole story, with even non-tradable inflation getting below 2%.
But this isn’t necessarily monetary policy failure – there was an unexpected decline in food commodity prices, which NZ exports, over that period. The central bank then responded in a way where inflation returned to the mid-point of the target.
Instead failure could be judged through inflation expectations. And we’ve noted for reasons here a good indicator of that is the labour cost index. Growth in that did slip, and as a result if monetary policy was seen too tight during the late-1990s (eg during the Asian Financial Crisis) it may be seen as somewhat too tight through 2012-2016. However, readings since then point to a central bank hitting its targets.
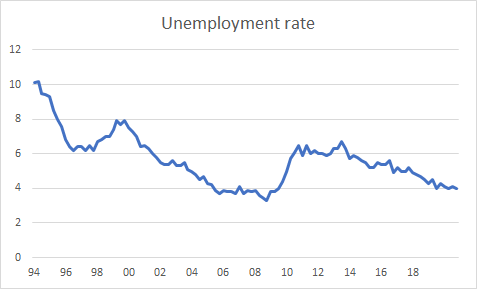
The unemployment graph above gives a similar story. Unemployment didn’t surge up again following the global financial crisis – but it did stay stubbornly high until 2016, and now has pushed its way down. Again, a sign of conditions that were too tight for a period – partially as a result of unanticipated shocks – and then what seems like reasonable monetary policy since.
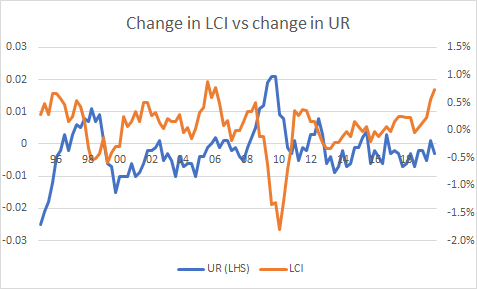
Changes in labour cost growth have been sharply related to changes in the unemployment rate through time, as shown in the above graph. This appears to give credence to the “unemployment rate as output gap” that is used by Gali – and is really closely related to simply thinking about a Phillips curve.
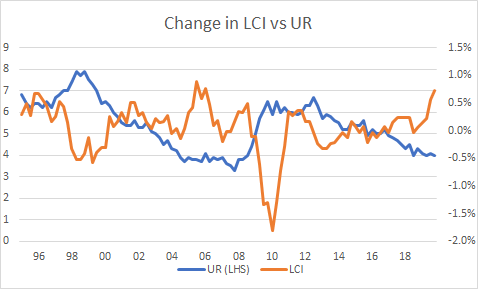
However, the key perspective is to think about the level of unemployment against LCI growth – namely is there a level of unemployment where wage growth/inflation accelerates [often noted as the NAIRU]. In this way, the unemployment rate has now fallen to levels where we have previously seen wage growth accelerate.
Pulling these all together, the RBNZ has managed to keep inflation near or in the target band, keep wage inflation close to the midpoint of the target, and we now have a low unemployment rate and accelerating wage cost pressures. This sounds like a situation where the central bank has succeeded in their aims – and maybe points to a situation where policy may need to tighten in the future!
Also note here that, the way we’ve discussed this is also sympathetic to the Fed – they never saw inflation collapse well below their target, and unemployment did gradually decline while labour cost growth was “anchored”.
Nominal GDP
However, there is another perspective here.
Let’s go back to the idea of NGDP targeting – as discussed here and motivated here. If Sumner’s monetary policy failure is with reference to this metric, let’s look at New Zealand. First NGDP relative to an exponential trend (so a fixed rate of growth)
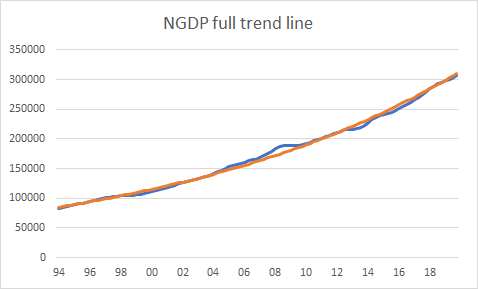
Things look a bit overheated between 2005-2008, and a bit underheated through patches of 2012-16, but policy has got us back on track!
But is this the right idea to look at Sumner’s view? For one, he is stating that it was policy post-2008 that failed, so the comparison should be to the trend line up to that point (say June 2008). Here we have:
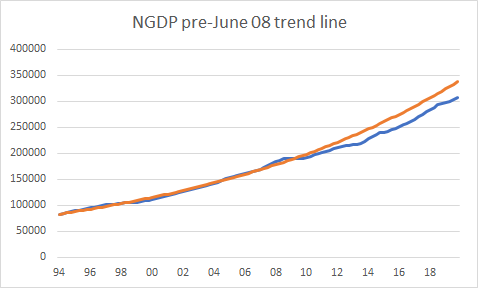
That doesn’t seem to be as positive a reflection on policy. But population growth has changed, let’s look at the graph with per capita.
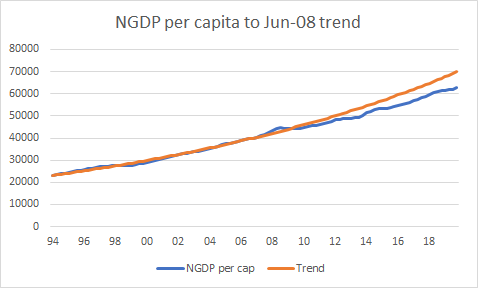
This appears to show a larger, and widening failure to meet this trend – which by Sumner’s definition constitutes policy failure.
Policy failures due to deviations from that trend can then be thought of as moving away from that target in two different ways: it could move away in a level sense (we undershot but will keep the growth going forward) or growth sense (continuously having lower growth so the gap gets larger). They mean different things.
However, if we are using the trend from 1994-2008 both of these things are happening – this metric is pointing to monetary conditions that are too tight both in terms of targeting a level AND targeting growth in NGDP (or demand).
Nominal GDP and LCI measures for New Zealand.
So looking at these measures what can we say?
If we work off the idea of capacity in the labour market, the unemployment rate did come down (note NZ’s participation rate was high the whole time – so we don’t have the US issue of discouraged workers) then it appears policy was pretty good.
Inflation measures were low, but New Zealand is a small open economy that was observing external price shocks – actual inflation expectations embedded in wage negotiations in the labour market came in near target, while “spare capacity” in the labour market has been limited for a while.
What about NGDP though? This seems less positive – if the goal was to stay on some trend line for NGDP growth monetary policy in NZ has been persistently too high. In fact, if the goal was to stay on a given rate of growth for NGDP policy may have even been too tight.
If this is the right metric, then there has been some degree of policy failure.
But if this was in the past, why does it matter for now?
Why it matters for now
When it comes to thinking about appropriate policy now, we need to think consistently with how we have judged policy in the past.
In that regard, we need to ask what is happening over the past year with the jump in the LCI number? There are two potential causes:
- Labour share rising due to greater bargaining power (keeping it with monetary policy, so in this instance assuming the share had been driven down for the same reason prior).
- Inflation expectations are rising – and a sign of coming inflation.
So recent labour market indicators are pointing to inflation/capacity concerns while NGDP well below trend points to space for potential growth.
Does policy need to be accommodative and allow these measures of “wage inflation” to rise or is this a signal of a closed output gap and the need to tighten policy. The US seems to be facing the same query, with their labour cost index picking up while NGDP remains below its pre-June 2008 track.
Understanding which is the driver – and how this can tell us about the appropriate stance of monetary policy – seems key right now.